The stock market declined for the third consecutive quarter, the first time this has happened since the Great Recession of 2008/2009. Year-to-date through September 30, the Standard & Poor’s 500 was down 24% and the NASDAQ was down 32%. Herein the focus will be not so much on the recent past but rather the key factors currently affecting valuations and pertinent historical context.
Economic and Market Overview
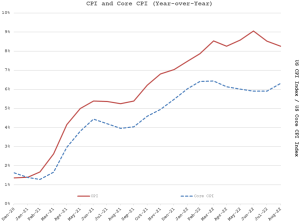
Since the beginning of the year, the primary focus of the markets has been on inflation, the Federal Reserve’s response, and the potential impact of rising interest rates on future economic activity. Year-over-year growth in the US Consumer Price Index (CPI) – the most-cited gauge of inflation – may have peaked in June at 9.06%, declining to 8.26% last month. This was driven in part by a pullback in prices for many commodities, most notably gasoline. While overall CPI may have peaked and started to decline, readings for core inflation, which excludes the more volatile energy and food components, remain at elevated levels, prompting some uncertainty.
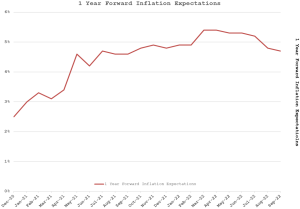
Monthly inflation readings are trailing indicators, but even forward expectations for inflation a year from now also may have peaked, according to the University of Michigan Surveys.
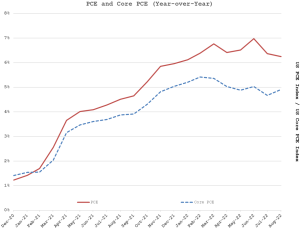
Meanwhile, the Federal Reserve focuses more on the Personal Consumption Expenditures (PCE) price index, which is more inclusive than the CPI. The CPI only includes urban areas, and it excludes spending funded via employer benefits such as many medical expenses and insurance. PCE also takes into account the substitutions we make when relative prices shift. If Coke and Pepsi had equal market shares, and Coke doubled its price while Pepsi did not change its price, and then all Coke drinkers switched to Pepsi, CPI would report a 50% inflation rate for this sector, but PCE would be unchanged. Back on point, the PCE price index, too, appears to have peaked in June at 6.98%, declining to 6.25% last month.
The Fed’s current median estimates for PCE and Core PCE (excluding food and energy) are in the following table. Plainly, they anticipate declining inflation, but their long-term target is not reached until 2025.
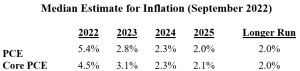
To help get to this target, the Federal Reserve increased the Fed Funds rate 0.75% in both July and September, bringing it to 3.25%. The Federal Reserve also increased the level it expects the rate to be at in the future, suggesting 4.4% by year-end, perhaps 4.6% next year, but then declining over time toward 2.5%.
One of the confounding factors of the current economic situation is the presence of elevated inflation as well as a tight labor market in a period of softening overall demand. Gross Domestic Product declined 1.6% in the first quarter and another 0.6% in the second; to some, the very definition of a recession. This drop in output occurred while unemployment has remained below 4%. In August it trickled up to 3.7%. The Fed’s chief mandate is to maintain price stability, but it is also mandated to foster full employment. In certain sectors, higher interest rates are already weakening demand further. For instance, new home construction and permits for such have plummeted this year, driven down by skyrocketing mortgage rates – now about 7% versus less than 3% a year ago. This makes the current situation challenging in that the Fed is looking to engineer a soft landing, hoping to ease wage pressure and prices in general while not sending the economy into a more significant decline.
Historical Market Perspective
While simultaneous high inflation, declining GDP, and low unemployment is unusual, it may be instructive to look at previous periods of high inflation and rising interest rates to understand the relationships and their impact on the equity markets. It is important to note that the equity markets are a discounting mechanism and often inflect before we see a change in the overall economic environment.
The early 1980s was the last time that the US faced significant inflationary pressure. Inflation peaked at 14.8% in March of 1980, the 10-Year US Treasury rate peaked at 15.8% in September of 1981, and an aggressive Federal Reserve raised the Fed Funds rate to as high as 20%. Currently, we are very far away from any of those figures. The chart below shows the course of inflation and the stock market during that earlier period. Although inflation declined from 1980 through 1982, the stock market still struggled.
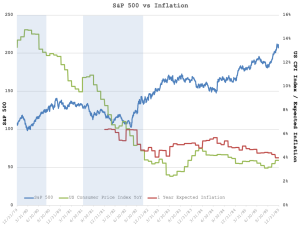
Note: The shaded areas are the periods of recession.
More interesting is the relationship between the stock market and interest rates. When interest rates declined in 1982, the stock market took off, beginning one of the strongest bull markets in history.
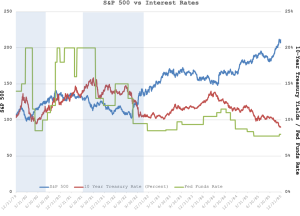
Note: The shaded areas are the periods of recession.
The strong inverse relationship of interest rates and equity market performance evident above makes intuitive sense, since future earnings have higher present values when discounted by a lower number. To put today’s equity market valuation in context, consider the S&P 500 trailing price/earnings ratios for different ranges of yields on the 10-Year Treasury since 1960, shown in the table below.
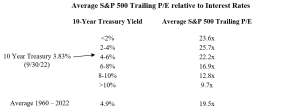
Not surprisingly, the data again show a noticeable inverse relationship between P/E ratios and interest rates. The S&P 500 is currently trading at about 19 times trailing P/E and 16 times forward P/E, suggesting that valuations are below historical norms given current interest rate levels. Of course, interest rates can go up further, and earnings could come in below current expectations. Despite some notable exceptions, corporate earnings have held up reasonably well so far. Still, there is a risk that the Fed goes too far with interest rate hikes and pushes us into a recession, which would indeed cause a decline in earnings.
Investing for the Long-Term
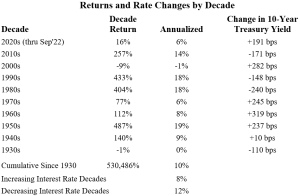
In difficult market times, it is instructive to put things into a longer-term context. The chart below shows returns of the S&P 500 by decade. We see that even during the challenging decades of the Great Depression in the 1930s, World War II in the 1940s, the Energy Crisis of the 1970s and the dot.com implosion, 9/11 and the Great Recession of the 2000s, markets have remained fairly resilient, even during rising interest rate environments. Over the long-term, equities provide an attractive return, about 10% per year since 1930; well above the 3.2% average annual rate of inflation. This is in part because equity investors are being compensated for the greater volatility and risk in stocks. Moreover, while higher prices increase costs, they also increase revenues and over time the value of corporate assets.
We also thought it would be instructive to put the current equity bear market in historical context. As commonly measured, this is the 13th bear market since 1950.
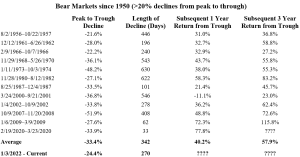
Over the years, the economy and markets have gone through many cycles. Often these pullbacks happen following periods of robust growth or stock market appreciation similar to what we experienced from 2019-2021, when despite the short-term Covid pullback the S&P 500 doubled. Moreover, historically we have tended to see fairly strong equity market performance following the trough of a bear market.
Of course, nobody can predict when a bear market has troughed. Often it is when times feel the worst. For example, during the Covid bear market, the market troughed on March 23, 2020 when the world had just entered full lockdown mode and people where in panic about overflowing hospital capacity. This highlights the importance of remaining invested for the long-term as the greatest stock market performances often follow periods of turmoil.
It is also important to point out that there is no guarantee that what happened in the past will happen again in the future. The economy still faces a lot of challenges ranging from a Federal Reserve, which is responding aggressively to inflation but may overshoot, to residual challenges from the supply chain issues brought on by a global pandemic, and a war in Ukraine which is disrupting international energy and commodity markets. News can get better, but it can also get worse.