In terms of the markets and news in general, 2022 was the kind of year one might prefer to forget. It was a year that experienced the residual impacts of the pandemic, including its associated supply chain disruptions, a Russia-Ukraine war that exacerbated global inflationary conditions, and aggressive central bank efforts across the world to moderate inflation by raising interest rates. For the year, in terms of total return inclusive of dividends, the S&P 500 was down -18.1% and the NASDAQ Composite declined -32.5%. Meanwhile, the bond market, which usually acts as a respite during stock market pullbacks, experienced its worst year by far in recent memory. The Barclays US Aggregate, which is a broad index of US investment grade bonds declined -13.0% this year, marking the worst annual performance for bonds and the first double digit decline in the post-World War II era.
During the fourth quarter, the equity markets saw a rebound as the Standard & Poor’s 500 increased +7.6% for the quarter, though the NASDAQ Composite continued to decline, returning -0.8% during this period. In fixed income, long-term rates stabilized while short-term rates continued their rise, bringing prices in this sector down just a little.
Economic and Market Overview
In our last quarterly letter, we discussed the importance of inflation in determining Federal Reserve Policy. We suggested that moderating commodity prices provided early signs of a potential peak in inflation, perhaps during the summer. Data released in the fourth quarter provided further evidence of a peak having transpired, though it also showed that inflation remains at elevated levels.
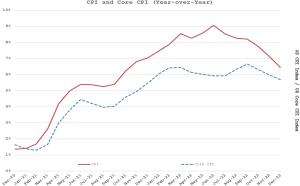
Putting pictures to words, the chart atop the next page shows the year-over-year growth in the US Consumer Price Index (CPI), the most-cited gauge of inflation which came in at 7.1% in the most recent month, down from 9.1% in June. Readings for core inflation, which excludes the more volatile energy and food components, show less improvement, prompting some uncertainty.
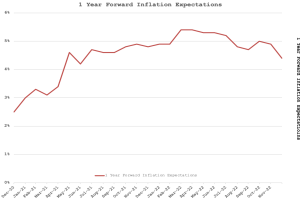
Meanwhile, forward expectations for inflation a year from now as measured by the University of Michigan Surveys also show signs that inflation expectations may have passed their apex during the summer.
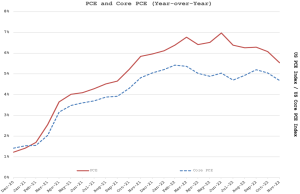
As mentioned in our last report, the Federal Reserve bases its policies more on the Personal Consumption Expenditures (PCE) price index, which is a more inclusive measure than the CPI. The PCE, too, peaked several months ago.
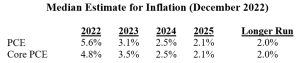
The Fed’s updated current median estimates for PCE and Core PCE (excluding food and energy) are shown below. The December estimates are slightly higher than those released in September, but they still point to moderating inflation in 2023.
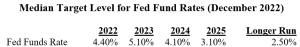
The Federal Reserve also modestly increased its expectations for the Federal Funds Rate, the rate it charges banks for overnight borrowing, expecting it to reach 5.1% in 2023; up from the current 4.4% before declining in 2024 and beyond.
As we look forward, there are several factors that will drive the economy in 2023. Rising interest rates are certainly slowing some sectors of the economy, most notably housing, driven by a dramatic rise in mortgage rates. We have started to see some downward revisions in corporate earnings expectations, and the broad consensus seems to suggest that the US will be heading into a mild recession some time in 2023. Much of Europe is in a mild recession already. The challenges from the geopolitical environment, whether it be the Russia-Ukraine War and its impact primarily on energy prices, or China’s decision to abandon its Zero-Covid policy coupled with the current spike in cases there, or chaos amid a leftward shift in Brazil and elsewhere in Latin America, all add to the uncertainty for the investment outlook.
On the flip side, unemployment remains near record lows, and the consumer remains in a relatively strong position. While inflationary pressures appear to be moderating, wage inflation seems quite sticky. From a socio-economic standpoint most of the wage increases have been experienced at the lower end of the wage scale, which in and of itself may not be a bad thing.
The Federal Reserve, though still in a tightening stance, has suggested that the pace of interest rate increases will likely slow going forward. And perhaps affirming that things are not as dire as headlines hint, real gross domestic product grew 3.2% in the third quarter, above expectations and a rebound from the modest declines experienced in the first half of 2022.
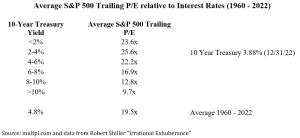
It is important to note that equity markets tend to be forward looking. They dropped much based on interest rate concerns way before rates shot up. Conversely, it is common to see stocks perform well when contemporary news is bad, and even while the broader economy is in a recession. For a market valuation perspective, we include the chart below from our previous quarterly letter, updated with year-end figures. The S&P 500 closed the year trading at 17.5 times consensus 2022 estimated earnings per share (EPS), 16.7 times 2023 EPS and 15.1 times 2024 EPS. While these estimates can and will change, they suggest that overall equity valuation levels, given current interest rates, are not over-extended. They might even be a little under-valued, which may provide some support for the stock market.
Historical Market Perspective
Given the difficult year just experienced, we thought it might be instructive to provide context. 2022 marked the 17th year in the post-World War II era in which the S&P 500 generated negative returns. So historically, the equity markets have experienced a down year about once every 4 or 5 years. The 2022 drop was also the 4th worst annual performance during this 77-year period. The question that usually follows is what comes next, what happens after a down year?
While no one has a crystal ball to predict the future, we do know from history that the market rebounded in 81% of the years following down years. Moreover, these rebound years averaged returns of 17%, well above the long-term annual pace of about 10%. The two exceptions were the stagflation and oil crisis of the early 1970s and 9/11 and the dot-com decline of the early 2000s. If we consider a longer horizon and look at the subsequent 5-year returns of the equity market, we see positive returns in every case except for the brief 1969 recession, which was followed by the aforementioned stagflation and oil crisis of the early 1970s.
Below is a table showing all 17 episodes of a calendar year decline, with returns for those years, the year following, and the 5-year span thereafter.
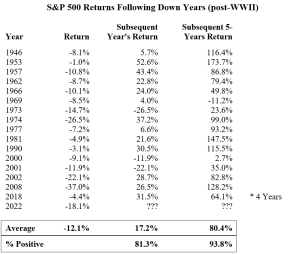
The past does not necessarily predict the future, but it is instructive and provides important context.
Fixed Income and Asset Allocation
As mentioned, 2022 was a historically bad year for the bond market. As rates were driven up by the Fed, prices for bonds already outstanding dropped. The longer the maturity, the greater the fall.
Aware of climbing prices and likely Fed policy over a year ago, for all clients with bonds, we shortened the maturity of our bond portfolios ahead of this rise. We also moved much into floating rate securities. Though not immune to a downward drift, our fixed income holdings saw only a small fraction of the overall bond market decline. Further, once rates approached and surpassed 4%, we started rotating from cash and short funds into solid investment grade bonds, adding stability and yield.
While no one wanted the drop in asset prices witnessed last year, one upshot is that fixed income investments now present attractive returns. For a while, and right up to the end of 2021, treasuries less than 5-years to maturity yielded less than a percent, and even long bonds returned less than 2%.
As of this writing, we are securing yields in the 4.7 – 5.2% range with investment-grade corporate bonds. For those who prefer even more safety and liquidity, we are getting between 4.3 – 4.7% with Treasuries. We are keeping maturities short to maintain flexibility in these changing times.
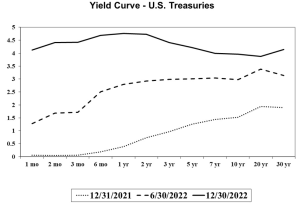
To help you visualize what happened to rates, below are yield curves showing treasury rates at the end the year, the year prior, and mid-year.
Because of the new rate picture and the uncertain nature of events, many people are reconsidering their asset allocation. This pertains to more than just the balance between stocks and bonds. To the extent excess cash has been kept in bank accounts partly due to the lack of extra return available elsewhere, there is the prospect of higher income with little extra risk; and no credit risk with treasuries. FDIC bank accounts are backed by the government. Treasuries are the government.