After a challenging 2022, the first quarter of 2023 proved to be equally volatile. The year began with a strong equity rally in January, driven by better-than-expected inflation reports. February witnessed a pullback as declines in inflation moderated. A volatile March, punctuated by concerns about the financial sector as three regional banks collapsed, nonetheless recorded gains in most sectors. In the end, the equity markets were up for the quarter, with the S&P 500 providing a total return of 7.5% and the Dow Jones Industrials up just 0.9%.
The fixed income side was also eventful as rates fluctuated meaningfully. During the period, the Federal Reserve raised the target of its benchmark Federal Funds rate a total of 0.5%. 6-Month Treasury rates rose from 4.77% at year-end to 5.34% in early March, settling back to 4.90% more recently. 10-Year Treasuries began the year at 3.88%, marginally surpassed 4% for a few days, but then declined to 3.48% as of March 31.
Economic and Market Overview
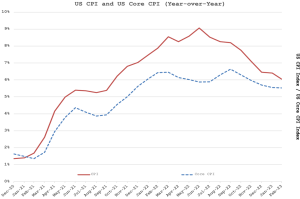
Throughout 2022 and into this year, much focus has been on inflation and the Federal Reserve’s response. We updated the chart mapping the Consumer Price Index (CPI) and Core CPI below. You will notice that the year-over-year rate of inflation continues to decrease, but more recent data suggests the rate of decline is flattening out. The disappointing pace of improvement has prompted concern that the Federal Reserve will need to continue to increase rates further, or perhaps keep them elevated for a longer period of time, in order to bring the inflation down to its longer-term target of about 2%.

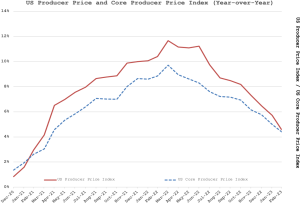
More encouraging are the trends in the US Producer Price Index, which measures the prices domestic producers receive for their output. Recent data suggests that the rate of inflation for wholesalers appears to have declined significantly. Often trends in wholesale prices presage trends in consumer prices.

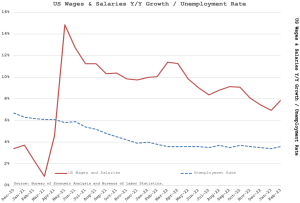
Part of the disconnect between these various measures is that much of the inflation that is being experienced is on the services side. In particular, wages at the lower end of the economic scale, which soared at double-digit rates during Covid, continue to climb at roughly an 8% pace. Despite large-scale layoffs at some of the biggest technology companies, which had gone through hiring sprees during the pandemic, the overall job market remains strong. Demand for services remains robust, and the unemployment rate – presently 3.6% – continues to hover near historic low levels. The chart below highlights both the climb in wages and the persistent shortage of available workers.

With that backdrop, the Federal Reserve raised the target of its benchmark Federal Funds rate 0.25% in February and an additional 0.25% in March. The Fed also suggested that these new levels might be close to the intended peak, indicating it would only conduct one more 0.25% rate hike this year. Fed Chairman Jerome Powell emphasized that the effect of interest rate increases usually takes some time to filter throughout the economy.
Partly due to the Fed’s fight with inflation, March witnessed the collapse of three specialized regional banks; Silvergate Bank, Signature Bank and SVB Financial Group. The latter two were taken over by the Federal Deposit Insurance Corporation (FDIC). Silvergate is being wound down and liquidated by its parent, Silvergate Capital. In Europe, there was an accelerated resolution to the longer-term problems facing Credit Suisse, one of Switzerland’s oldest and most storied banks, which was bought by its rival Union Bank of Switzerland (UBS), with the support of the Swiss National Bank. For some, these events brought flashbacks to the bank failures during the Great Financial Crisis in 2008 and 2009.
We thought it would be instructive to provide some context around these bank failures. For instance, it is important to note that bank failures, often brought on by bank runs, have occurred regularly throughout our history. One of the primary reasons FDIC insurance was established during the Great Depression was to protect depositors and provide a level of trust in the American banking system.
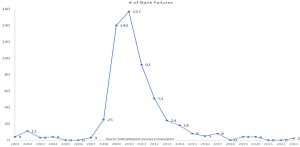
The chart below plots the annual number of bank failures in the United States since 2001. We have averaged 25 bank failures per year so far this century. As you might expect, the number of failures was greatly exacerbated during the Great Financial Crisis of 2008 and 2009 and its aftermath.

The majority of these bank failures have involved smaller local banks, which do not grab the national headlines. The average asset level of banks that had failed since 2001 is $1.8 billion. By comparison, Silvergate had $15 billion in assets, Signature $110 billion, and SVB $175 billion.
Silvergate focused almost exclusively on servicing and lending to the digital asset economy (cryptocurrencies). With the decline in the valuation of digital assets coupled with challenges and the collapse of a number of digital asset exchanges, Silvergate was forced to wind down. Signature Bank faced a similar situation, as it was one of the leaders in the cryptocurrency lending space. Subsequently, New York Community Bancorp (NYCB) purchased the non-crypto related assets and deposits of Signature Bank from the FDIC.
While the downfall of Silvergate and Signature can largely be blamed on cryptocurrencies, SVB Financial was somewhat different. SVB – the nation’s 16th largest bank by assets – had built a business catering to the innovation economy centered in the Silicon Valley area. It provided financial services to a range of start-up companies, venture capital and private equity firms as well as entrepreneurs. In the last few years, as the venture-backed economy boomed, deposits at SVB skyrocketed to $198 billion in the middle of last year, up from $62 billion just prior to the start of the pandemic. Faced with this huge deposit growth and slowing loan demand, SVB had a massive amount of money to invest. SVB elected to purchase primarily agency issued mortgage-backed securities (MBS), collateralized mortgage obligations (CMO), commercial mortgage-backed securities (CMBS) and municipal bonds. These securities have very high credit ratings and therefore were viewed as very safe. But credit quality is not the only risk entailed in bonds. The problem with SVB’s portfolio was its duration risk, the threat to the value of these bonds should rates rise. The longer the maturity, the greater the magnitude of such valuation changes. SVB held about $91 billion face amount of bonds in the category of assets termed Held-To-Maturity”, which do not have to marked at their actual value. Of this $91 billion, $86 billion, or almost 95%, was in securities with duration of over 10 years. A rise of only 1% in rates could cause a decline of over 10% in value. When forced to sell, those losses get realized.
As we had discussed last year, there is meaningful risk to the value of long-duration bonds in a rising interest rate environment. Anticipating the potential harm, we shortened maturities in bond and balanced accounts during Covid as we did not want to lock in the artificially low rates for a long span. As longer-term interest rates started to increase last year, the under-lying value of these longer dated bonds declined significantly. For SVB, these forces caused the underlying unrealized loss on their investments to balloon to over $15 billion, approximately equal to their entire book equity value. At the same time, the venture capital funding market began to slow down, and small venture-backed companies were drawing down on their deposits to fund their operations. Faced with this triad of declining deposits, a decrease in value of their securities portfolio and the need for liquidity, SVB decided to sell some of its Held-To-Maturity bond portfolio, thereby realizing losses, and looked to raise additional equity capital to support their business. This spooked investors and precipitated its downfall, which caused a run on the bank.
Aside from the concentration in Silicon Valley and its ecosystem, the other aspect of SVB that was somewhat unique to the company was the concentration of its depositor base. Unlike most larger banks which have millions, if not tens of millions of different deposit accounts, SVB’s deposit base was extremely concentrated, with only about 30,000 accounts. Perforce, the average account size was huge, well above the $250,000 limit for insurance coverage under FDIC. In total, over 80% of SVB’s deposit base was uninsured, significantly higher than most other banks. Given the uninsured exposure and concerns about the bank’s problems, word spread very quickly in the close-knit Silicon Valley community and there was a run on the bank as companies panicked, fearing an inability to fund their businesses and payrolls. In response, the FDIC decided to step in by guaranteeing all customer deposits. Perhaps more importantly system-wide, the Federal Reserve created the Bank Term Funding Program wherein banks could deposit certain assets and receive credit for the face value regardless of the interest-rate-depressed market value.
In the subsequent weeks, much of the regional banking market appears to have stabilized with the exception of some smaller regional west coast based banks, most notably First Republic Bank (FRC), which like SVB is a California-based bank with a large proportion of uninsured accounts. A consortium of 11 of the largest financial institutions in the country have come together to provide $30 billion in short term liquidity funding for FRC, providing a brief respite, as the company works to develop a more permanent solution. At this point the banking crisis appears to be contained and isolated, although as with most of banking there is always the potential concern about contagion. We remain vigilant in assessing and monitoring the banking environment and its potential spillover into the broader economy.
While the rise in rates damaged the valuation of bank assets and most fixed income portfolios, it has opened up new opportunities for people to garner higher income. During the first quarter, we bought high quality short-term (2 years and less) bonds with yields over 5% at times. Rates peaked in February when the inflation news was at its worst. The bond market then stabilized until the banking crisis hit, fostering a flight to safety. Short-term rates barely moved as the Fed’s rate increases kept upward pressure on the front end, but intermediate and long-term rates dropped.
