Meanwhile, after three consecutive quarters of stocks rebounding from last year’s inflation and rising rate driven decline, the equity markets pulled back in the third quarter. During the past three months, the Standard & Poor’s 500 Index fell -3.3%. So far this year, the S&P 500 returned 13.1% through September 30, but most of the gain has been concentrated in only a few of the largest companies. The equal-weighted S&P 500 is virtually flat this year, up a mere 0.3%. The often-cited Dow Jones Industrial Average of blue chips stocks has also struggled, up just 2.7% year-to-date.
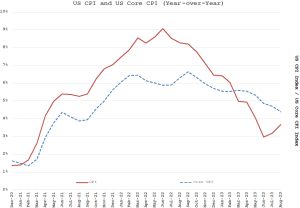
As we discussed in our prior letter, the Federal Reserve remains focused on inflation. While the rate of inflation has been declining since the second half of last year, it remains stubbornly high, as you can see in the updated chart below mapping changes in the Consumer Price Index (CPI). This persistence raises concerns about whether the Federal Reserve needs to tighten monetary policy even more than anticipated.

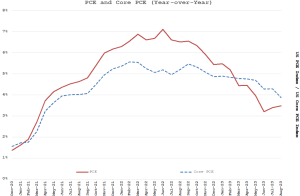
The year-over-year inflation rate has declined, but it remains well above the 2% Fed target. This is true of the well-known CPI and also the Personal Consumption Expenditures Index (PCE), which is what the Fed regards as a more accurate barometer.

Looking more closely at the month-over-month data to get a better sense of recent trends, we see the last 3 months of data annualize to about +3.2% for the PCE and +2.0% for the Core PCE. The components of this index varied. Base commodities such as copper and lumber, often associated with manufacturing and construction activity, have declined this year. Many of the agricultural commodities such as wheat, corn and soybeans have declined as well. However, oil prices have rallied over the last few months, in part driven by production cuts from Saudi Arabia and other OPEC members and more recently by heightened geo-political tensions. Wage inflation remains robust, with labor market conditions still very tight. This has continued to put the Federal Reserve in a difficult position in its battle with inflation.
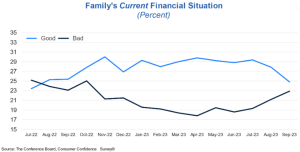
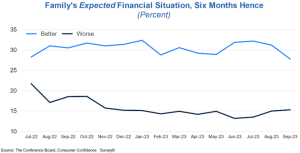
While members of the Federal Reserve Board had previously suggested that it was nearing the end of interest rate increases, recent developments caused the Fed to reconsider. In the most recent Fed Board meeting, the target Fed Funds rate was left unchanged, but the Board indicated an additional rise of 0.25% was likely before the year’s end. Meanwhile, we are seeing signs that the cumulative impact of tighter monetary policy is slowing the economy. The housing market, facing higher mortgage rates, has cooled; manufacturing activity remains modest; and the US consumer, who is the driver for 70% of the US economy, is exhibiting signs of softening sentiment as shown in the Consumer Confidence surveys below.


In addition, there are several factors that could provide further headwinds to the domestic economy. The Covid era pause on student loan repayments expires at the end of this month, while strikes at the big 3 auto manufacturers, rising energy prices, and continued dysfunction in Washington DC are somewhat disquieting. Moreover, household savings that had been spurred by various forms of Covid aid are now depleted. Two of these factors can serve to taper inflation, but the other two exacerbate it, and they all raise concerns about a potential recession. We believe these issues may put a temporary damper on the markets. Still, the United States remains the strongest economy in the world, while China is facing its own challenges with a collapsing real estate market, Europe continues to stagnate, and turmoil in the Middle East has presented new uncertainty.
Market Overview
As mentioned earlier, one of the more interesting features of this year’s stock market has been the extreme concentration of equity market returns. The newly termed Magnificent Seven, the largest 7 companies by market cap – Apple, Microsoft, Alphabet (Google), Amazon, Meta (Facebook), Tesla and Nvidia – comprise almost 30% of the S&P 500. They have drawn most of the attention and increased on average by 88% this year while the rest of the stock market has been flat. In fact, the median stock in the S&P 500 is up only 1% so far this year and about half of all stocks in the S&P 500 are down on the year. This level of disparity in returns is almost unprecedented. For reference, during the prior decade (2012-2022) the equal weighted S&P 500 Index returns were virtually the same as the market weighted S&P 500 index. Clearly, that has changed dramatically this year.
This disparity in performance has rendered a divergence in valuation as the market weighted average forward price-to-earnings ratio (P/E) of the Magnificent Seven is 32.5 times 2024 earnings per share (EPS). The overall S&P 500 is trading at an estimated P/E of 17, implying that the S&P 500 excluding the Magnificent Seven is trading at a P/E of about 11. While much is due to the expected growth in earnings for the Magnificent Seven, we do wonder if this valuation gap is rather large and potentially concerning.
While the Magnificent Seven includes terrific companies and you have exposure to several of them in your portfolio, we are cognizant of the concentration of the stock market and the respective valuation levels for these companies. In some ways this type of concentration is reminiscent of the Nifty 50 stocks of the late 1960s into the early 1970s. The Nifty 50 stocks were the largest and most envied companies of their time and included well-known household names such as Johnson & Johnson and General Electric, but also companies like Eastman Kodak and Polaroid that eventually went out of business as technology and the economy changed. The Nifty 50 stocks dominated overall equity returns in the late 60s and into the early 70s and traded at premium valuation levels, because they were viewed as almost invincible. The Nifty 50 stocks ended up crashing in 1972-73 as their valuation levels dropped to levels closer to the broader equity markets. At their peak in 1972 the Nifty 50 traded at a P/E ratio of 42, while the overall S&P 500 was trading at a P/E of 19. We are not arguing that something similar will occur with the Magnificent Seven, but we are mindful of the forces at play. Diversification is a cornerstone of risk management in a portfolio. Aware of valuation levels and position and industry concentrations, we feel it would be imprudent to weight your portfolio too heavily in only a few stocks.
Circling back to the macroeconomic picture and its impact on the bond market, we continue to enjoy the ability to maximize yields while minimizing risk in bond portfolios. At some point, the Fed will succeed in its fight against inflation, at which point short-term rates will drop and longer maturities will present better values. Moreover, it is likely that yields on the long end will end up closer to their historical norms, which are much higher than we have experienced between for most of the past decade. At present, we are getting 5.5% on Treasury securities less than a year to maturity and above 6% on very short investment grade corporate bonds. Short bonds are also very liquid, so when market conditions change and it is opportune to shift, we will be ready and able to do so.
