The third quarter saw the continued market recovery from the tariff induced selloff in April, as the impact on inflation so far has been more muted than initially feared, and the economy has remained resilient despite a softening labor market.
The returns for the major domestic stock market indices were:
| Index | Q3 2025 | Year-to-date |
|---|---|---|
| S&P 500 (Large Cap) – Market Weight | +8.1% | +14.8% |
| S&P 500 (Large Cap) – Equal Weight | +4.8% | +9.9% |
| S&P 400 (Mid Cap) | +5.6% | +5.8% |
| S&P 600 (Small Cap) | +9.1% | +4.2% |
During the period, the yield on the benchmark 10-year U.S. Treasury declined slightly from 4.23% to 4.15%. Rates on bonds of shorter maturities fell a little more, with the 3-month T-Bill moving from 4.41% to 4.02% while long-term rates did not move much at all, with the 30-year T-Bond down a nickel, from 4.78% to 4.73%.
Economic Overview
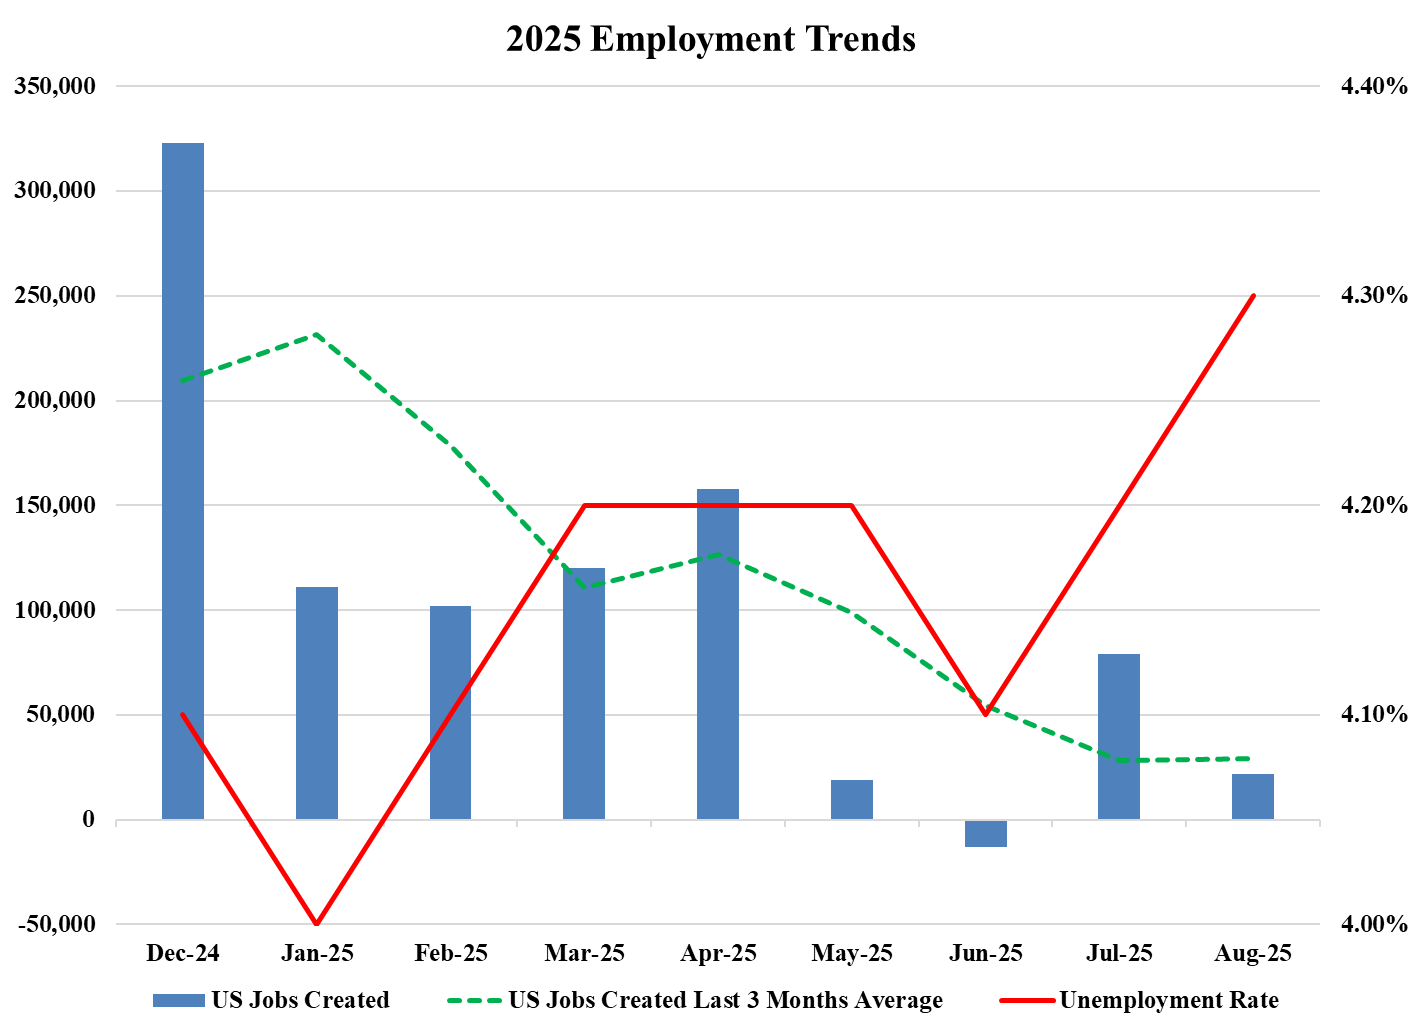
The quarter was highlighted by the Federal Reserve’s decision to cut the Fed Funds rate by 0.25% in September, the first time it has done so this year. The Federal has a dual mandate: maintain stable prices and support maximum employment. The factors that influence these two mandates have been at odds this year, further complicating the picture for the Fed. As shown in the chart on the following page, the number of jobs created by the U.S. economy has slowed this year, particularly since April in the wake of new tariff policies that went into effet on “Liberation Day”. Correspondingly, the unemployment rate has trickled up. The weakening labor market was the primary reason for the recent rate cut, and it could foster further cuts in the near future.
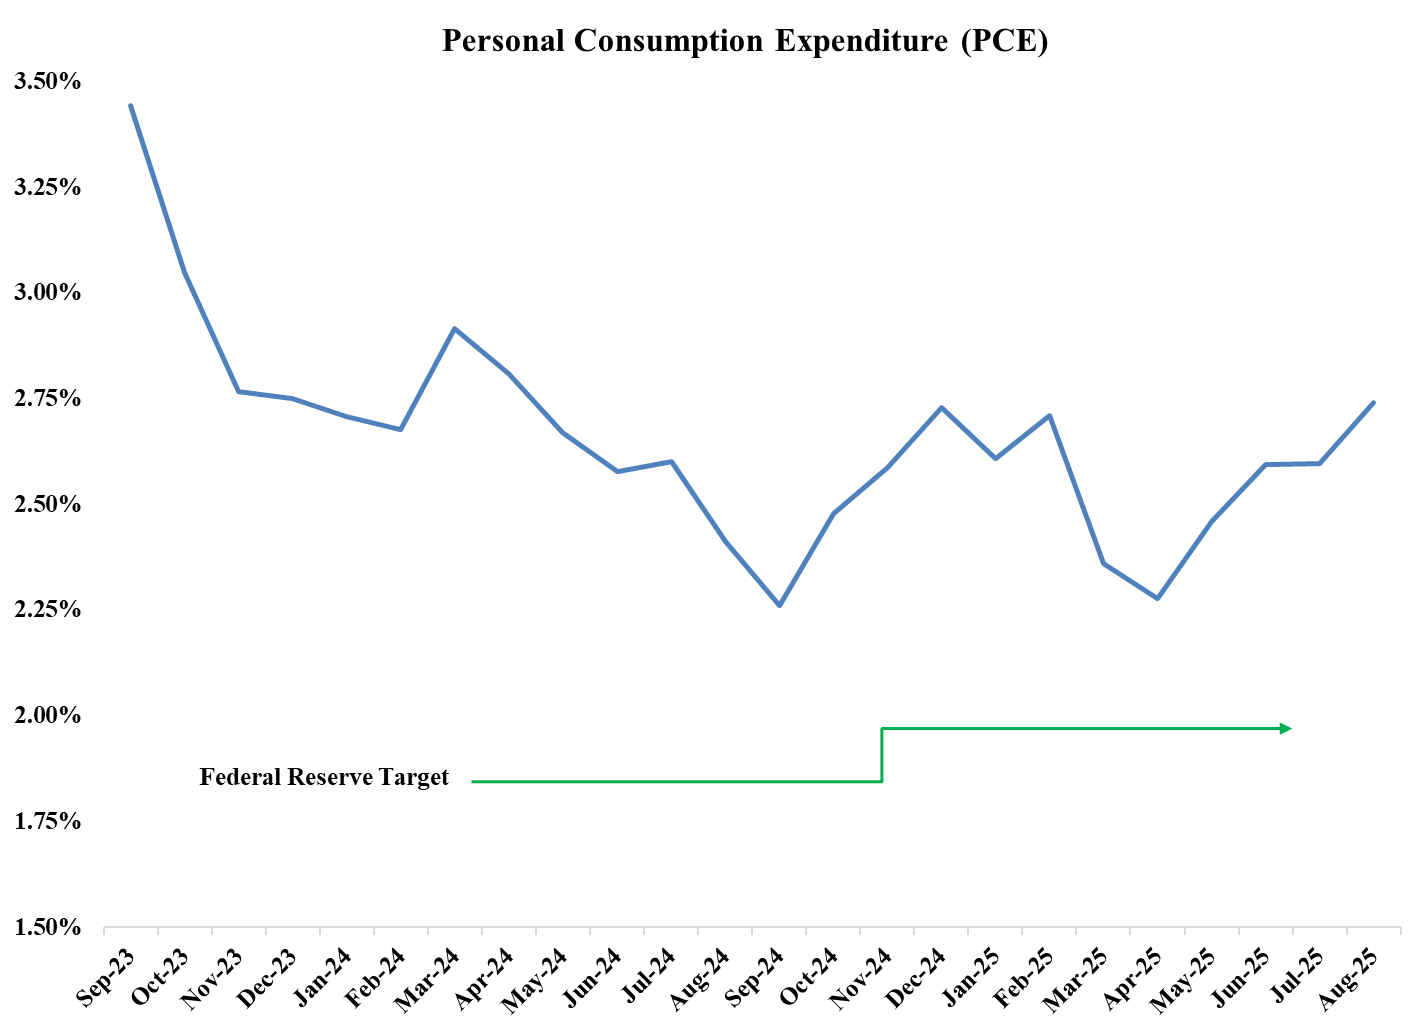
But, the Federal Reserve’s other mandate, price stability, is presenting challenges as inflation remains stubbornly above the Fed’s stated target of 2%. As shown in the chart below, the Fed’s preferred gauge of inflation, the Personal Consumption Expenditure (PCE) Price Index has started to tick up over the last few months as some of the inflationary pressure from the tariffs may now be starting to flow through to the consumer.
Adding a further wrinkle is the current fiscal health of the U.S. government. The federal budget defict as a percentage of GDP remains elevated at more than double its historic average since WWII. Ordinarily, the deficit expands during a financial crisis as we saw in the Great Financial Recession of 2008/2009, or during extraodinary events such as wars and most recently the Covid Pandemic. Usually, the deficit declines as each crisis subsides and the economy recovers. This process was evident in the most recent cycle as the trailing 12-month federal deficit plumeted from a peak of about $4.1 trillion in March 2021 to about $869 billion in October 2022. But since then, it has grown, averaging about $1.2 trillion in 2023, $1.4 trillion in 2024, and about $2 trillion this year.
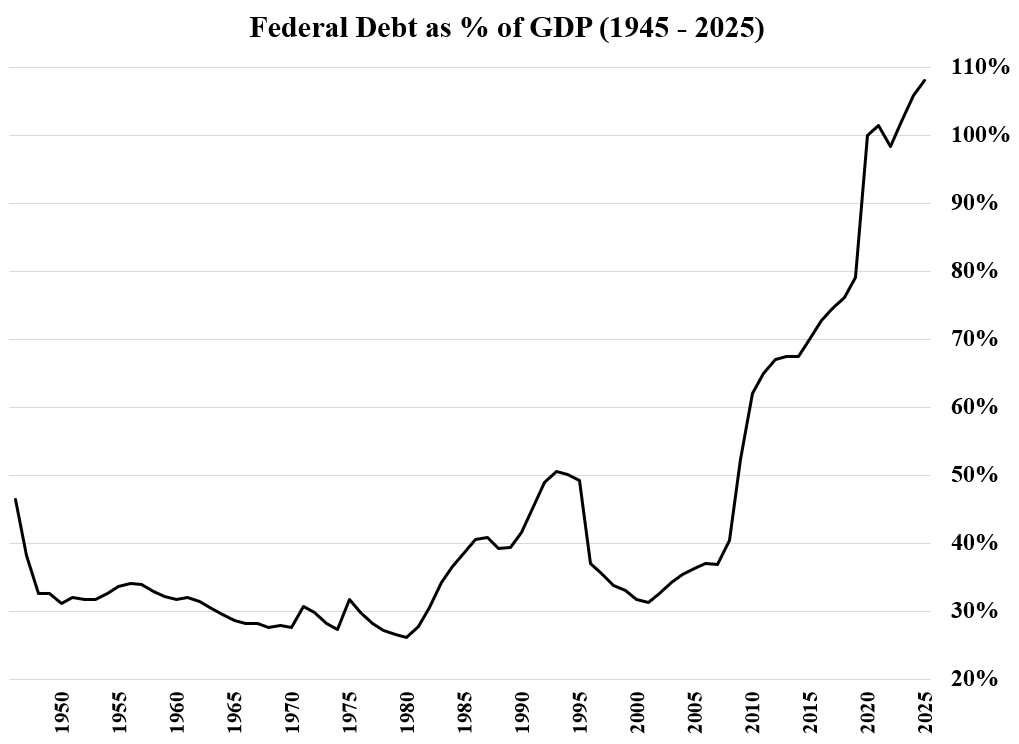
Those deficits of course add to the govenrment’s existing borrowings. Federal debt as a percentage of GDP has exploded in recent years. In addition to the annual inflows and spending, interest costs are accelerating. Much of the borrowing during Covid was done at near zero interest rates. New debt and replacement of old maturing debt is now costing between 3.8% and 5%. It is interesting that Microsoft can now borrow money at lower rates than the U.S. Treasury. Although that is a sign of more concern about the federal deficit, it is very hard to tell if we are anywhere near where the dam might break.
The high, sustained deficits, coupled with the overall amount of debt outstanding may at some point trigger the “bond vigilantes”. These are bond market participants who balk at new government bond offerings and even sell their positions due to concerns over the amount of bonds the government needs to sell. This can cause a rapid rise in long-term rates and is one of the reasons we have kept the fixed income portion of portfolios short in duration.
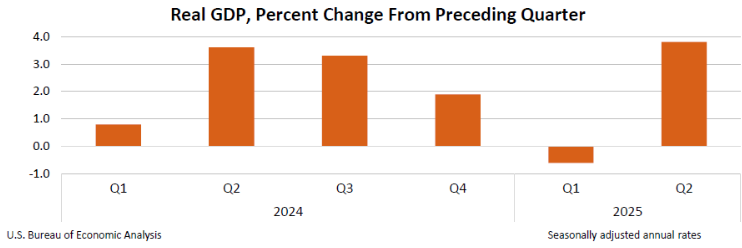
Meanwhile, the economy continues to grow at a good clip. After a pullback in the first quarter that was largely driven by a spike in imports in advance of the new tariffs, the second quarter showed a rebound. The Federal Reserve Bank of Atlanta’s GDPNow forecast is estimating a fairly robust 3.9% GDP growth for the third quarter. Whether or not this type of economic growth can be sustained given the headwinds presented earlier remains to be seen.
Markets
Presented with the economic growth, robust corporate earnings, and prospects for additional rate cuts, equity markets have been strong so far this year. Once again, much of the gains have been led by the technology sector propelled in part by excitement over artifical intelligence. The tech sector now comprises about a third of the S&P 500. If you include technology related companies that are classified in other industry sectors such as Alphabet (Google, Communications), Meta (Communications), Amazon (Consumer) and Tesla (Consumer), which with Microsoft, Nvidia, and Apple make up the Magnificent 7, that figure jumps to almost half of the S&P 500.
There have been previous periods of significant industry sector concentration in the markets, including energy in 1980 at almost 30% of the market, following the 1973 Oil Crisis and later the Iranian revolution, technology at about 35% at the peak of the dotcom bubble, and financials at almost a quarter of the market in 2006, at the heyday of aggressive lending shortly before the Great Financial Crisis. In each one of these cases there was a meaningful subsequent pullback. We are not suggesting that a decline is in the offing for technology, as most of the leading tech companies have terrific business models, strong balance sheets, attractive cash flows, and significant growth prospects. Nonetheless, we are attentive, and we prudently maintain proper diversification and avoid excessive concentrations.
At the end of the quarter, the S&P 500 was trading at 24.7 times estimated 2025 earnings and 22.7 times estimated 2026 earnings, valuation levels in the top quartile of historical ranges. By comparison, the average forward price to earnings multiple for the Magnificent 7 is 48.7 times 2025 earnings, and 38.8 times 2026 earnings. However, the weighted average projected earnings per share growth rate for the Magnificent 7 in 2026 is 20% compared to 9% for the overall S&P 500, which may justify some of the premium valuation. Whether or not those growth expectations are realized will be key for the market’s direction. If earnings growth disappoints, the risk is a double whammy from both lower than expected earnings as well as shrinking price to earnings multiples.
There are risks beyond valuation. Many market participants are unnerved by the threats to the independence of the Federal Reserve. There is concern in some quarters that cuts in interest rates may exacerbate inflation. This may be a major reason that gold is up about 50% so far this year. The share of household wealth committed to stocks is at record highs, above the level at the peak in 2000. That begs the question of how much buying power is left.
We have one other concern that is not affecting prices now, but might at some point. The crypto markets are a bit like the Wild West. A meltdown there could produce selling in the stock market to cover losses in the crypto world. This is a largely unregulated area, which is a danger in and of itself. We are simply keeping a watchful eye.
That metaphorical watchful eye pertains to fixed income as well as equities. As previously mentioned, the Fed is in a tough position, wanting to lower rates to support a weakening economy, but wary to do so because inflation is still over target. Higher tariffs worsen both inflation and employment, while the expanding federal budget deficit puts upward pressure on rates. Meanwhile, a quest for extra yield in various sectors, such as corporate and agency bonds, has led to very narrow spreads, meaning the extra yield above riskless treasuries. In this environment, we continue to buy treasuries of very short maturity. Very little is sacrificed in terms of income. More critically, we have dry powder ready to redeploy into higher yielding bonds of other sectors when spreads widen, or into longer bonds when the yield curve steepens, or into newly cheaper stocks if any of the concerns raised earlier come to fruition.