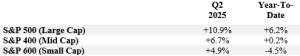
After a rocky start to the year, punctuated by the roll out of the new Administration’s tariff policies on Liberation Day, the stock market rebounded as many of those initial tariff provisions were either rolled back or delayed allowing more time for negotiated trade agreements. The returns for the major domestic stock market indices were:
Meanwhile, bond yields changed very little as anticipated inflationary effects from tariffs continue to offset signs of weakness which might otherwise induce the Federal Reserve to trim rates. Yields on very short Treasury bills ended the quarter at about 4.35%, while the 10-Year Treasury bond stood at 4.23%.
Economic Overview
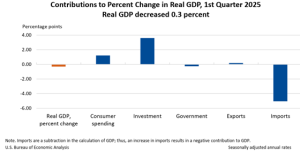
President Trump’s tariff war and weaker consumer spending translated to a contraction of 0.5% in the U.S. economy in the first quarter, even more of a drop than the 0.2% that economists expected. As shown in the chart on the following page, net trade subtracted 4.6% from first quarter GDP due to a surge in imports as consumers and businesses stocked up in anticipation of the tariffs taking effect.
For the second quarter of 2025, the Federal Reserve Bank of Atlanta’s GDPNow forecast is estimating positive GDP growth of +2.6%, largely due to a reversal of the first quarter’s import surge.
Since our last review, the most important development impacting future economic developments was passage of the budget reconciliation bill (“The Big Beautiful Bill”), signed into law by President Trump on July 4. According to the nonpartisan Congressional Budget Office, the tax cuts and spending shifts entailed in the legislation will add an extra $3.3 trillion to the deficits already projected over the next ten years.
Running larger deficits can be stimulative to an economy, which tends to push markets higher. But when such deficit growth is deemed to be too excessive, the music can stop and market vigilantes can force a reckoning. This has happened in the past quarter century in places ranging from Argentina to Thailand to Russia. Those events all happened suddenly, wiped out much wealth, and created significant economic stagnation and often hyperinflation. While many of the warning signs were present, the exact timing of the collapses was impossible to predict. We are not predicting such will happen here, but we thought it timely to put the new fiscal trajectory in perspective.
Presently, the annual federal budget is about $7 trillion, with about $5 trillion collected in taxes, leaving a deficit of $2 trillion. At this level, the current deficit equates to about 6.6% of GDP, which presently sits at about $30 trillion. With the additional $330 billion, that percentage rises to about 7.7%.
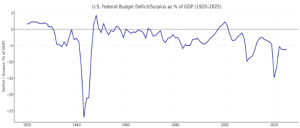
The chart below puts the federal budget deficit in a historical context. You might notice that the current budget deficit as a percentage of GDP is higher than historical averages and only eclipsed by the increased spending during World War II, the Great Financial Crisis of 2008/2009, and the COVID epidemic. Higher deficits are usually the result the federal government trying to stimulate the economy during a crisis.
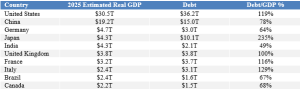
How does our deficit compare to that of other countries? As seen in the following table, among the 10 largest economies in the world, our deficit’s percentage of GDP is the third highest, exceeded only by Japan and Italy.
In some sense, market vigilantes may have already started to act. So far this year, the dollar has fallen by about 12% versus the Euro, the worst start for the dollar since 1973. This is a complete change in course as the dollar was up 6% in 2024. It is no coincidence that gold has been strong this year, due in part to dollar weakness. It rose 25% during the first half of this year.
Further, while interest rates on debt maturing from a month to about 10 years have not moved much, rates on 20- and 30-year bonds have crept higher. Sitting at less than 4% last September, they have recently hit and at times surpassed 5%. Bond vigilantes may be disruptive when new bond auctions present quantities never before seen. Meanwhile, rates could also rise as a means of supporting the dollar.
Meanwhile, interest payments on the national debt are projected to total $952 billion in fiscal year 2025, nearly half of the total deficit. Add to this the interest on the massive new debt and then multiply all this by higher interest rates should such ensue, and one can envision a troubling, spiraling problem.
The bottom line is that we are watchful without reacting to every little eruption coming out of Washington DC.
Markets
After such a strong quarter, we thought it opportune to put some focus on valuation. The chart below shows a 40-year history of the forward price to earnings ratio of the S&P 500.
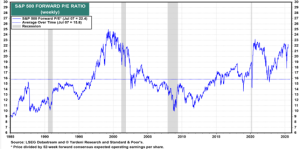
You will notice that the current valuation at about 22 times forward earnings per share is towards the higher end of its historical average, only to be eclipsed by the bull market of the late 90s. By comparison, the S&P 500 has traded at an average of 19 times earnings over the last 5 years and 18 times earnings over the prior decade.
With relatively low unemployment, moderate inflation (though it is too early to have a full sense of the impact of tariffs), a Federal Reserve that is still expected to lower interest rates in the second half of this year, and now additional fiscal stimulus, the economy could continue to remain strong. Faster growth generally justifies higher valuation. Price to earnings multiples are just one measure of valuation, of course. There are other important factors, especially the pace at which corporate earnings are expected to grow.
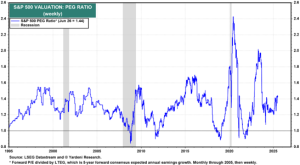
One frequently cited, though imperfect measure, is the P/E to Growth Ratio, or PEG Ratio. The PEG ratio tries to relate valuation levels as measured by price to earnings ratio with the expected future earnings per share growth rate with the thought that a higher valuation level can be justified with faster expected growth.
As shown in the chart below, the PEG ratio for the S&P 500 is currently at 1.44, in line with the averages of the last 30 years. Whether or not that expected growth materializes will be key to the direction of the stock market.