
During the second quarter the broader equity markets continued to appreciate. However, there has been significant dispersion in returns this year. The gains of the S&P 500, which is weighted according to each company’s size, were extremely concentrated, with the largest five firms comprising the majority of the overall index’s returns year-to-date. This market-weighted S&P 500 returned +16.9% for the first half of the year while the index weighting each of the S&P 500 firms equally returned +7.0%. Other broad equity market indicators posted modest results. The Russell 2000 Index of small cap stocks rose +8.1% while the often-cited Dow Jones Industrial Average increased +4.9%. Stocks paying a high dividend performed worse in the first half, with the S&P 500 High Dividend Index falling -6.4%.Economic OverviewThe primary concern over the last couple of years has been inflation, with focus on the Federal Reserve’s response. We have been closely monitoring the key statistics and provide an update below. 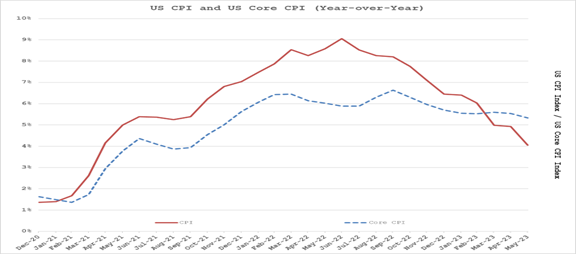 In the most cited measure of inflation, the Consumer Price Index (CPI), we see that the overall inflation rate continues to come down, which is good news. Unfortunately, the core rate, which excludes the more volatile components such as food and energy, remains stubbornly high. The Federal Reserves preferred measure of inflation, Personal Consumption Expenditures (PCE), shown below, displays a similar pattern.
 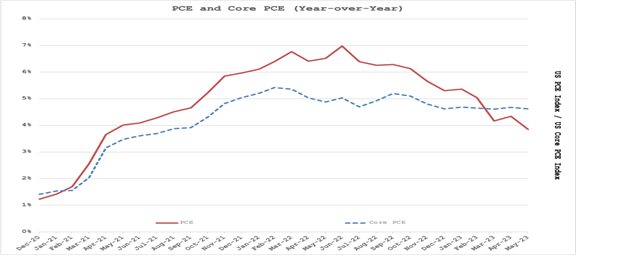 Economic activity has also declined in the wake of the Federal Reserve’s push towards tightening monetary policy. A closely followed measure for anticipated economic activity is the Purchasing Managers Index (PMI) for both the services and manufacturing sectors of the US economy. Index readings above 50 signal economic expansion while those below 50 suggest economic contraction. We see both services and manufacturing activity have slowed down since the Fed started to raise interest rates in early 2022. Manufacturing activity actually contracted over the last half year.
 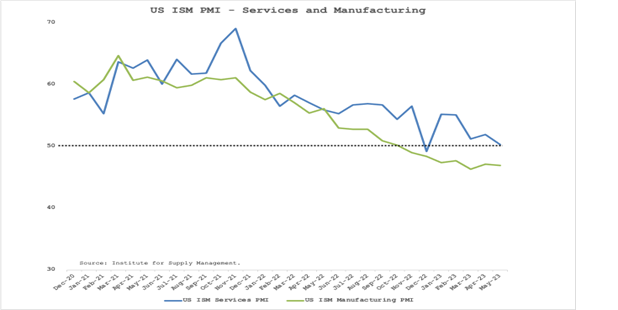 With this backdrop of moderating, though still stubbornly high core inflation, and weakening economic activity, the Federal Reserve decided to pause its interest rate hikes at its most recent meeting in June, but it indicated it will remain data dependent in evaluating further future rate hikes. The current market expectation is that the Fed is near the end of its interest rate hiking cycle.The largest component of inflation, about a third of both the CPI and PCE indices, is housing. As housing is often impacted by previous changes in interest rates and regional economic activity, housing inflation usually lags other components of the indices. The current hope is that higher mortgage rates will dampen pricing in the hot housing market experienced in the wake of the pandemic and the Federal Reserve’s then-aggressive monetary accommodations. As seen in the chart below, rising mortgage rates have slowed pricing for both new and existing homes sales in the United States.
 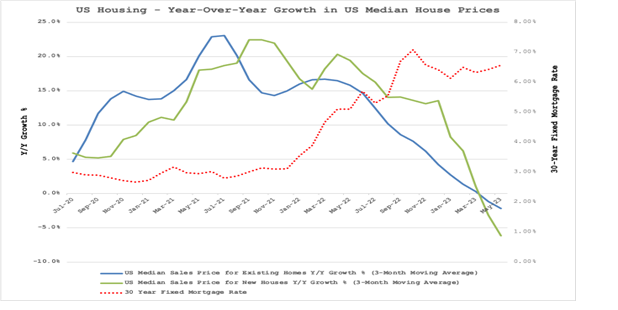 Higher mortgage rates have also slowed the pace of new single-family housing units sold, as well as new housing starts, which is an indicator of homebuilder confidence and future home sales. As prices have come down and mortgage rates have stabilized, we have seen unit sales and new home starts begin to rebound, suggesting that there is continued strong underlying demand for housing, even at higher mortgage rates.
 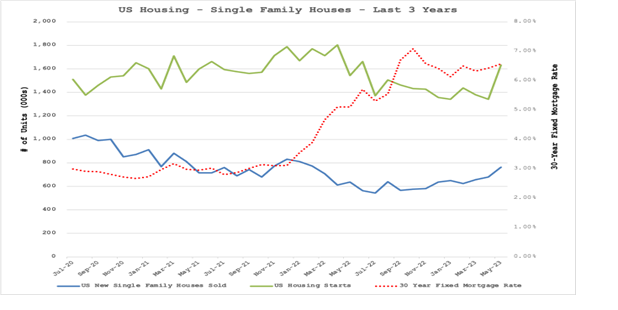 With inflation, in particular core inflation, remaining stubbornly above the Federal Reserve’s long term target range, the labor market continuing to remain very tight, and housing showing signs of resilience and a bottoming out, the Federal Reserve may need to continue to continue to tighten monetary conditions above current expectations despite what appears to be a slowing economy. This is a dynamic that we will monitor closely. Equity Market Overview How do these economic factors translate into the stock market. As we mentioned previously, the returns of the S&P 500 have been extremely concentrated this year, as shown by the difference between the market-weighted S&P 500 and the equal-weighted S&P 500. At the end of this quarter, we now have five large technology-oriented companies with market capitalizations of over $1 trillion dollars. These have led the overall stock market gains this year. As seen in the chart below, this level of concentration of the stock market is at historic highs and gives us some pause, especially when we also consider some of the underlying valuation metrics.
 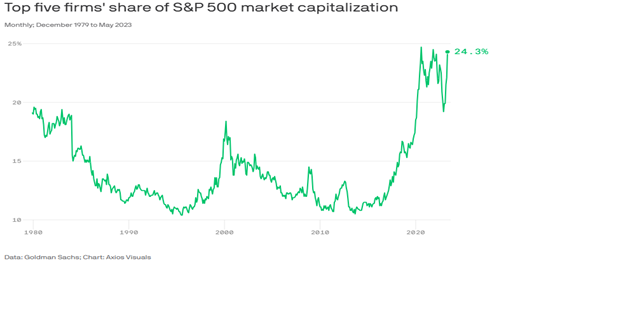 For instance, this year there has been much excitement around artificial intelligence (AI) and its potential, which is helping to drive some of the stock price movements of the largest technology companies. We thought it would be instructive to compare the current valuation multiples of the largest five companies by market capitalization with their average over the last decade to put their current valuation in a historical context. The five largest companies had a combined market capitalization of $9.3 trillion as of June 30, which is more than 25% of the $37.1 trillion market cap of the entire S&P 500 – the index of the 500 largest public companies in the US. This is the highest level of concentration that has ever been recorded.
 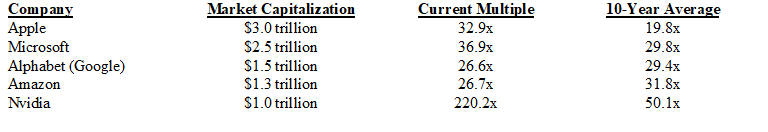 Note: Figures as of 6/30/23. Multiples represent current P/E multiples except for AMZN which is generally valued on an EV/EBITDA multiple basis as their business model is different. We note that some of these large technology companies are trading at historically high valuation levels. While some of this may be warranted by changing dynamics, we have shifted some of the portfolio from more expensive technology-oriented areas towards firms that could benefit if inflation remains more elevated or valuation multiples moderate.Meanwhile, within balanced and bond accounts, we continue to focus new purchases on treasuries and high-quality investment grade bonds with very short maturities. While the Fed has paused, it may not be done increasing rates. When they are done, the yield curve should ‘normalize’, presenting higher long-term rates and lower short-term rates. We can extend maturities for secure longer income then. In the meantime, we are staying short, conservative, liquid, and reaping higher income as we do so.