If you look at a chart of the S&P 500 for the past quarter, it looks fairly calm with a net gain of 1.3%. But beneath this calm surface were some rather difficult undercurrents, especially in April as discussed in my previous letter. And unlike the first quarter when the Nasdaq rallied, it fell by 1.8% this quarter. Although we spent the rest of the quarter slowly regaining ground lost in April, we still lagged the market [by a bit / somewhat] for the quarter with a decline of xxx. [The good news is that we are still modestly ahead of the market for the year, up xx% versus 2.6% for the S&P 500.
I’ve done my best to dissect what went on, and have the following observations:
- there was a sharp selloff in interest rate sensitive stocks in April, as the market correctly anticipated that the Fed would raise interest rates sooner than had been expected
- there was a mini-panic in China-sensitive stocks (including the steel companies) on overblown fears of a sharp deceleration of growth in China
- there was a brief but sharp underperformance of small cap stocks relative to larger cap shares, again just in April
- my system had its first period of underperformance since the fourth quarter of 2002
- some of the stocks that did well this quarter did not seem like particularly good relative values at the beginning of the quarter
Let me elaborate briefly on some of these points, beginning with some stocks that did well which we did not own. Over time, we’ve done well by owning stocks that have a reasonably short “payback period” (ie, time in which the projected earnings stream pays back the current stock price). Those projected earnings streams are subject to a filter to try to assess the reliability of the estimates. In the past quarter, some stocks with quite long payback periods did very well – without us. Sometimes these strong performances are justified in retrospect, and sometimes not. Certain companies such as Yahoo and Ebay have consistently exceeded even very aggressive earnings estimates. For instance, Ebay has had compound earnings growth of 98 percent over the past three years. So the price appreciation is understandable. I did not foresee such rapid earnings growth. Yahoo has had similarly good growth, but even a doubling of earnings was not enough to stop the stock from falling over 17% in the first six days of this new quarter. The stock was simply priced too rich. [1]
Some low-growth companies, usually in the consumer staple sector, get bid up because they seem like safe places to be in a volatile market. Take Clorox, for example. It began the quarter with a payback period of over 11 years, yet still returned 10 percent for the quarter. But this is a company with a PE ratio of 21 and an earnings growth rate of about half that. That simply does not strike me as an attractive valuation, but we missed a good short-term rally in this stock. A number of stocks like Clorox, in the consumer staple sector, had strong quarters. But I don’t think that stocks with such valuations are a great way to invest in the long term.
My System. My system simply had a poor period, underperforming for the first time since the fourth quarter of 2002. It’s lagged in four of the last 16 quarters, and will again. Part of it was missing stocks like Ebay, Yahoo and Clorox. But the stocks that it did pick simply did not do particularly well. Nor were there any big winners, which can make up for a lot of smaller losses in a good period.
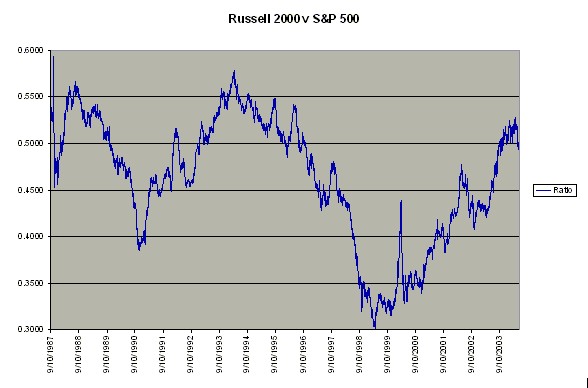
Small Cap Stocks. As the following chart going back to 1987 indicates, small cap stocks have outperformed large cap stocks rather consistently for the past five years. As this chart makes clear, there was a brief period as the bear market started in early 2000 where small cap stocks sharply underperformed.
 But as this shorter term chart demonstrates, there was a short term reversal in this trend between early April and mid-May.
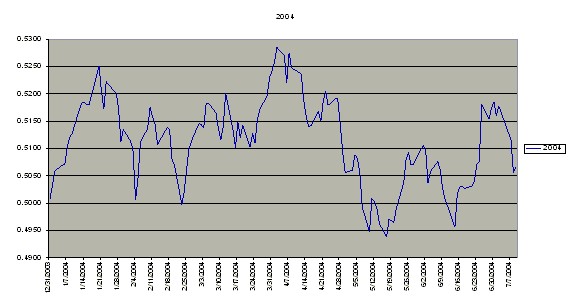 While that just looks like a squiggly line, it means that there were days when large cap stocks were down by a percent and their small cap brethren were down by 2-3 times as much. At June 30, the ratio was Russell 2000 at 591.52 / SPX at 1140.84 = .5185.
China. China has accounted for much of the demand at the margin for everything from steel to oil. In April, there was a lot of press to the effect that China was growing too fast and that the government would have to clamp down to prevent runaway inflation. US Steel fell from 40 to 26 in a month. It was back above 35 two months later. After having sold much of our position on stop-loss orders, we bought back into USX at just over $27. The China episode is an example of the type of undercurrent I mean – USX lost a third of its value before coming almost all the way back to where it had been.
Interest Rates. The mood in the first quarter was that the Fed would wait until at least late summer and possibly until after the election to raise rates. Then a lot of strong economic data came out, and the markets correctly re-assessed that the Fed would move sooner. That affected financial and consumer stocks in particular. For instance, Dicks Sporting Goods fell over 20 percent in six weeks – before rallying to new highs. Good end result, but a very nasty crosscurrent and unpleasant drawdown in April. Some stocks did not rally back. For instance, Friedman Billings Ramsey fell from over 28 to under 17, and rallied back only to 21. This rapidly growing investment bank is seen as overly dependent on mortgage-related financings.
On the subject of interest rates more broadly, the earnings yield on stocks is still reasonably favorable relative to yields on US Treasury securities. Market history gives no clear guideposts as to when the relationship between the earnings yield on stocks and Treasury yields are within a normal band. History does suggest that one should be extremely cautious if Treasury yields are more than 2 percent above the earnings yield on stocks. However, there are many periods during which the market rallied when the earnings yield on stocks was only modestly higher than Treasury yields. At present, the earnings yield on stocks is still about 2 percent above the yield on the five year Treasury. I interpret that as moderately favorable for stocks, but hardly compelling.
Valuation is not sufficiently compelling to keep stocks moving up if geopolitical circumstances change. In fact, one might expect renewed concerns about terrorism around the time of the Republican convention. That might be a time in which to tighten certain risk parameters.
Normally, I spend about half of a letter on individual holdings. Right now, we own any number of relatively attractive stocks. My experience is that sometimes these stocks move quickly, sometimes they take awhile, and sometimes the earnings picture becomes less favorable. I’ve been particularly frustrated with Pfizer. Here is a company that has grown earnings at over 19% annually for the past three years, but trades at a PE of only 16 times 2004’s estimated earnings. It’s considered one of the best (if not the best) pharmaceutical franchises in the world. Value Line projects a compound annual return on the stock of 17 to 23 percent; my system projects around 10 percent. But it has been stuck in neutral all year. Similarly, Everest Re is earning $11 to $12 per share, has grown earnings at over 25% annually this decade, and trades at a PE of 8. Value Line projects a compound annual return on this stock ranging from 9 to 21 percent; my system projects over 20%. But Everest is another one stuck in neutral, or slightly worse. There are a number of others like these, which is part of what made the past quarter so frustrating.
My experience is that when you make intelligent investments in such companies, you’ll win over the long term. The short term is harder to predict. But I feel that we are well positioned for the remainder of the year. As always, I’m happy to discuss all this with you in greater detail.
[1] Most academic studies conclude that such rapid earnings growth is unsustainable for most firms over more than a few years. See, eg, Journal of Finance, Vol. 58, pp. 643-684, April 2003 So the dilemma is whether to pay for a huge growth multiple, risking that you will do so at just the time when such growth starts to decelerate (as may be the case with Yahoo).
* Past performance is not necessarily indicative of future performance. Results for individual clients may vary. Results are not audited. Byrne Asset numbers reflect the addition of certain dividends and deduction of all fees. S&P numbers are based on the total return of Vanguard’s S&P 500 Index Fund.