The stock market as measured by the S&P 500 Index had a total return of 5.49 % in 2007. But it was a bumpier ride than usual, and the returns of other indexes and types of stocks varied considerably. The Nasdaq Composite rose by 9.81%, but the Russell 2000 Index of a broader universe of stocks fell by 1.57% (all total return figures). Your account gained 6.92% for the year. This figure accounts for the addition of dividends and the subtraction of my quarterly fees.
Changes in credit conditions were the main influence on the stock market this year. Early in 2007, loose lending policies were fueling takeovers including the $45 billion Texas Utilities deal. Takeovers produced more bullishness by promoting the belief that more premium bids for stocks would quickly follow. But even in early spring, as noted in my letter of last April, concerns about sub-prime mortgages were already percolating. Market pundits thought that the sub-prime situation could be contained, because only about 15% of all mortgages were sub-prime, and most of them were still performing. Then the plot thickened. Prices broke suddenly in mid-July, and four months of stock market gains were wiped out in only four weeks.
Two separate but closely tied forces dominated the market for the rest of the year. First was the mortgage mess itself, which meant larger than expected write-offs for banks and more bad news for housing stocks. Second and more significant was the fear of a credit crunch becoming more widespread. The concern is that banks are becoming afraid to lend in general, and that there may be reduced liquidity in the commercial paper market that many corporations rely on for short-term funding needs. How much of this is real and how much is simply anticipation is hard to discern, but market psychology and prices don’t necessarily wait for those answers.
Stocks rallied back early in the fall as the mortgage crisis itself seemed to peak, but another downdraft occurred as the more general credit concerns came into sharper focus. So 2007 ended on a downbeat note with the S&P having a total return in the fourth quarter of -3.33%. We lagged that slightly, with a – 3.79% return.. We managed to navigate the year pretty well by hitting a lot of singles. We had excellent returns for the year in stocks such as Potash, Petrobras, BHP Billiton, Manitowoc, Coca-cola, McDonald’s, Proctor & Gamble, Humana, Turkcell, and several others. We were not big home run hitters this year, but we limited our errors.
Touching upon those few “errors”, we held onto high quality financial stocks such as AIG and Lehman and Thornburg Mortgage, which had minimal exposure to the sub-prime world but still got punished, and we started to accumulate certain value stocks too soon. That didn’t help us in the fourth quarter, but if the economy stabilizes, we should be in a good position to reap some major rewards in 2008. There is an old market aphorism: “don’t catch a falling knife”. But if the compound annual return projections on my system reach 25% or so for a given stock, I often view it as a good risk-reward situation. Earnings can fall further than expected, and the stock in question can continue to drop. But often enough, one will wind up buying in at great levels.
Once every few letters, I try to give a detailed example of my analysis. So let’s take a closer look at one stock that fell sharply in late 2007 before we made a modest purchase – JC Penney. I discuss JCP even though it is not a big position now, because it sets forth the dilemma between buying compelling value on one hand, and “catching a falling knife” on the other.
JCP was featured in the December 14 issue of Barron’s, which noted that it “could ring up a nice rally over the next year”. One fund manager said the stock was the cheapest he’d seen it in 15 years. Here is how I quantified both the risk and the reward sides of the equation. First, the risk. Between June 1998 and April 2000, JCP plunged 84% in 21 months. A similar path from its high of $87.18 last February would take it to $14.25 by December 2008. That’s a fall of another 66% on top of the halving that has already occurred. That is why I use stop-loss orders; if I’m six months early, it’s best to cut losses and try again later.
Now let’s look at the reward side of the equation. In early November, I had no idea if anyone would go shopping during the holiday season. But what I did know was that taking all the uncertainty into account, the consensus among analysts was that JCP would earn $5.16 per share in 2007 and $5.91 in 2008. These analysts also thought that JCP would manage to grow earnings at an average of 15.3% annually out to 2012. This did not seem unreasonable in light of the fact that JCP had been growing earnings at over 40% annually since 2002. Nothing says that earnings must grow. Perhaps they would backslide to the 2006 level of $4.84 per share. Even at that level, the stock would still have been at a relatively low PE of 11 at early November’s stock quotes.
Here is some further analysis I used. At the earnings estimates cited above, JCP’s earnings stream would pay back the stock price in 6.25 years. I capture these “payback periods” quarterly for each stock I follow. Here is quarterly “payback” data for JCP back to 2002:
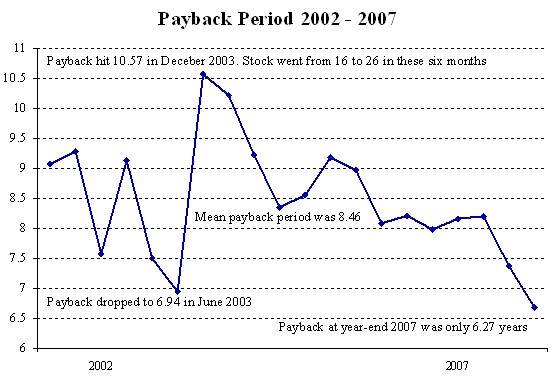
If JCP returned to its average payback period of 8.46 years with no change in earnings estimates, the stock would go from $54 to $88! The earnings estimates can most certainly drop further, and there is nothing to stop the payback period from falling further as well. It may also be that earnings estimates are not dropped as quickly as they once were due to SEC rules limiting what a company can tell securities analysts between quarterly announcements. But earnings estimates still represent the collective best guess of experts at a given point in time.
I did this analysis in some detail so that you can see the thought process behind an investment, and because this example is a window into my evaluation of the overall market situation now. If we go into a recession, earnings estimates for stocks (particularly consumer and financial stocks) are bound to decline further. The market is sensitive to change and rates of change in earnings estimates, and could decline more accordingly. But if the economy stabilizes, many stocks are compelling values right here. I remember buying a lot of stock in July 2002 using similar logic. Though I use stop-loss orders and realized some embarrassing losses that September, another compelling value situation presented itself again in October. The buying I did in that period did much to set up a 50% year in 2003. I find that sometimes I have to take more than one shot to get it right.
As longtime clients know, I tend to be a more cautious buyer when the S&P 500 Index is below its 200 day moving average, as it is now. While it is nice to buy low, we don’t have to buy at the lowest level to make money once the market turns, so we can be patient if necessary. Yet it would be nice if we could just sit back and wait for our favorite stocks to fall by 85% and then buy them before they go back to new highs. But most pullbacks are nowhere near that magnitude. As JCP climbed 12-fold between 1981 and 1998, it had pullbacks of 49%, 45%, 32%, 27%, 21%, and many other smaller drops. Our best clues as to optimal timing will come from monitoring earnings estimates and valuation on a daily basis.
I am running the same sort of analysis on many other stocks. Banks and brokerage stocks are cheap. Housing stocks are very cheap; Hovnanian is trading at 31% of its book value and has already fallen 90% from its peak. That seems irrationally un-exuberant, even though the housing and mortgage markets remain a mess. But the pendulum can swing wildly between moods of greed and fear. Needless to say, consumer and financial stocks are much more economically sensitive and have wider swings than companies that sell soap or drugs. We made plenty of money in housing stocks at the outset of the decade, and did so without being early buyers.
I have spent much of this letter discussing stocks that have been unusually weak in recent months. Thus it is worth reminding you that a good many of the stocks we own already have had good positive momentum. This is certainly true of our holdings in the energy sector. Talk of $100 oil has been commonplace; that level was touched on the first day of 2008. A holiday drive on a very congested I-95 made me think that higher prices have yet to dampen consumer demand for gasoline. Given the apparent lack of demand elasticity, I wouldn’t be surprised to see energy prices continue to rise in 2008. Certain oil service stocks are cheap, and it seems to me that more drilling will have to take place in 2008 and beyond.
2007 was also a year in which growth stocks (eg, Google, Apple, Oracle) did better than so-called “value” stocks. Value stocks often include lower PE stocks in sectors such as banking, housing and energy. If a PE ratio goes from an already cheap 10 to a very cheap 8 and all else is equal, that implies a 20% drop in the price of a stock. Just because something is a “value” stock doesn’t mean it can’t get a whole lot cheaper. The Morningstar index of large cap growth stocks gained 13.8% in 2007, while the comparable index of value stocks fell by 1.9%. There was also a premium on safety this year. According to Morningstar, large cap stocks gained 6.7% for the year while small cap stocks lost 0.7%.
In 2003, we had a great year by hitting several home runs. This year, we had a very respectable year by hitting a lot of singles and limiting our errors. Although our relative performance was good, it would have been better with higher weightings in utilities, large cap growth stocks such as Google, and commodity related stocks like BHP Billiton (BHP). However, BHP moved 3% or more on almost a quarter of the trading days last year, and I do try to limit volatility in a portfolio. The commodity-based stocks were high return this year, but are also high risk. Meanwhile, certain selections such as AIG that were highly ranked by my system did not do so well. AIG’s biggest drop in earnings in the past decade was 2%, between 2001 and 2002. The company has re-affirmed its earnings projections and called its mortgage exposure “manageable”. No matter; the stock fell 18.7% for the year. Similarly, I thought that since Thornburg Mortgage held only top grade mortgages, it would not be lumped in with sub-prime lenders. Wrong. Guilt by association and concerns about liquidity in the money markets caused top grade firms such as Thornburg to retreat as well.
My view of the market as a whole for 2008 reflects the same analysis as I presented for JC Penney. The market is now fairly cheap (though not absolutely compelling) relative to earnings and interest rates. In July, the earnings yield on the Value Line Index was about 1.05 times the yield on the five year Treasury; that number is now a more rewarding 1.6 times Treasuries. That ratio exceeded 2.0 at the market bottom in 2002. Economic prospects have to be pretty bad for the market to weaken considerably from here. Yet market cycles and credit cycles can last longer than many pundits expect. Indeed, as the market slid in 2001-02, we spent much of the time debating whether we were in a recession. If bankers hide under their pillows and refuse to lend, the economy could worsen. If value trumps fear, it could be a very good year. My system continues to analyze an ever-broader universe of stocks. Our risk management systems have done their job reasonably well. In fact, as the market slid in November, our worst relative performance was late in the month on a few up days. I cannot eliminate risks, but I make every effort to contain them in a weak market.
I appreciate your continued confidence and hope to produce another year of outperforming the S&P in 2008. As always, I welcome any questions or thoughts that you may have. I always enjoy lunch with clients, so don’t hesitate to get in touch.
* Past performance is not necessarily indicative of future performance. Results for individual clients may vary. Results are not audited. Byrne Asset numbers reflect the addition of certain dividends and deduction of all fees. S&P numbers are based on the total return of Vanguard’s S&P 500 Index Fund.