Last year at this time, we looked ahead to 2013 and noted “the potential for PE expansion of 12% just to get back to the mean level for the decade. Add 5% earnings growth and we have the potential for another double digit year.” The stock market rallied even more than we thought it would. Many investors were spooked by the dysfunction in Washington, but the country as a whole continues its history of entrepreneurialism, optimism and growth despite obstacles.
We had an excellent year. The S&P 500 ended the year at 1848.36 and provided a total return (Vanguard Index Fund, appreciation plus dividends) of 32.18%. Your account gained 37.59%. For the quarter, the market gained 10.5% and your account was up by 11.4%.
Can this keep up? The market can continue higher, but I’d be surprised by another year like 2013. Now that market valuations have overcome 2008 phobia and regressed back toward mean levels, further gains depend upon growth in GDP and in corporate earnings – and perhaps more importantly, corporate revenues. I say that because companies have squeezed a lot on the cost side and are generally running at peak operating margins, so now the key is growing the top line. The most recent GDP reading of 4.1% growth exceeded expectations and suggests reasonably bright prospects for continued growth and accelerating corporate profits.
What about when the Fed slows and eventually stops its buying of $85 billion of Treasury and mortgage-backed securities each month? Will interest rates spike? Will that cause a sharp drop in the stock market? Early indications are no; the market responded quite favorably on December 18 and thereafter to the Fed’s announcement about tapering (ie, slowing its purchases). That was not surprising. Based on the steepening of the yield curve in 2013, I think many market participants have already mentally adjusted for where interest rates “should be” once the Fed shifts its policy. Ten year Treasury securities now yield 3%; they could move to 4% easily. That level would be consistent with current inflation plus the average amount historically that the ten year Treasury has been above the Consumer Price Index. But even should Treasury yields rise all the way to 4%, stocks would still offer good value relative to bonds. It is worth going into some detail on this point.
I have gone back and looked at the year-end levels and annual earnings for the S&P 500 for every year since 1949. I calculate the trailing price-earnings ratio for each year, and calculate the reciprocal to find the earnings yield. We then subtract the yield on the ten year Treasury from the earnings yield to find the so-called equity risk premium. This chart shows how that has looked for each year since 1985 (data before that often shows a negative number and is probably less helpful):
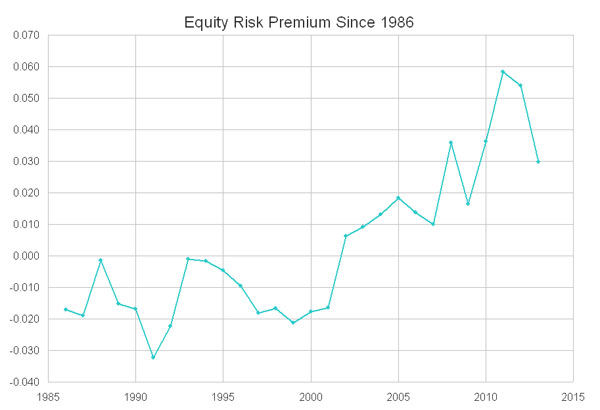
We now have a yield on 2013 earnings of about 5.95% (reciprocal of 1848 index/110 earnings) and the ten year Treasury ended the year at 3.03%. That produces an equity risk premium of 2.92%. On the chart, stocks still look pretty cheap relative to bonds at that level. That is why the statistical simulations run by the smart quant team at Alliance Bernstein recently indicated that stocks should outperform bonds over the next decade in 85 of every 100 simulated instances. Note that the earnings yield is 30% higher than it was in 2007 and twice what it was in 1999.
The counter-argument is that bond yields are being forced to artificially low levels by the Fed, and when quantitative easing is tapered or halted, those yields are almost certain to rise. Fair enough. Ten year Treasuries have historically yielded on average (with quite a range) about 2.7% over inflation. Inflation is now about 1.3%. So let’s assume that ten year Treasuries go to 4% from their current 2.9%. That alone drops the equity risk premium to about 2.1%. That still leaves room for the market to move higher. The equity risk premium got down to the 1.00 – 1.30% area (depending on the precise measure) at the market top in 2007. It was negative by about 2% before the market peaks in 1987 and 1999 – quite a way away. The equity risk premium has been negative for a good part of the post WW II period, and according to Yale economist Robert Shiller about 25% of the time since 1881. This generally occurs at times when investors expect high growth in corporate earnings.
Of course inflation could kick up, and bond yields could rise even more in response to that and change these numbers dramatically. But I think it makes much more sense to monitor current trends than to assume such trouble. If there are unanticipated fundamental developments, there should be time to adjust as necessary.
It is still a market of stocks, and valuations run the gamut. Our database projects double digit returns on some stocks, and sees many other stocks as already overvalued or at least at their peak valuations of the past decade based on current v historical ratios of prices to earnings, cash flow, and revenues. To appreciate the variance, this is how our system valued the cheapest and richest Dow stocks at year-end based on earnings projections (including growth in the out-years):
| Ticker | Stock | Price | Payback | EE 2013 | EE 2014 | Est Growth |
|---|---|---|---|---|---|---|
| JPM | JPM Chase | 58.52 | 7.17 | 4.42 | 6.02 | 9.0 |
| IBM | Intl Bus M | 187.56 | 7.42 | 16.87 | 18.01 | 9.8 |
| CSCO | Cisco | 22.46 | 7.30 | 1.98 | 2.10 | 10.5 |
| CVX | ChevTx | 124.97 | 7.50 | 11.47 | 12.02 | 9.5 |
| TRV | Travellers | 90.56 | 7.67 | 8.84 | 8.14 | 10.5 |
| JNJ | Johnson | 91.61 | 10.55 | 5.48 | 5.85 | 8.0 |
| BA | Boeing | 136.52 | 10.89 | 6.73 | 7.49 | 10.0 |
| PG | Proctor | 81.38 | 10.89 | 4.28 | 4.66 | 9.2 |
| KO | Coca-cola | 41.34 | 11.19 | 2.09 | 2.23 | 9.5 |
| NKE | Nike | 78.34 | 11.21 | 3.05 | 3.54 | 12.7 |
The cheapest Dow stock by these measures is JP Morgan. This is due in part to bank stocks usually being cheaper (and perhaps riskier) than stocks in general. But JP Morgan has often been a good buy on bad news; eg when the London whale trade hit, it went from 46 to 31 (or about 10x what the bank actually lost) and back above 50 within a year. At 58.50, it still seems reasonably priced though not downright cheap. On the other hand, stocks such as Coca-cola and Proctor & Gamble seem to have been bid up because they are seen as “safe” – but this means the stock prices have probably discounted most of the good news that about their earnings.
Let’s look more closely at Proctor & Gamble. It is a great company, and its products are bought in good times and bad, so it is “safe”. But because it is safe, it has been bid up to valuation levels not seen in many years. The following grid shows the stock’s valuation using our payback calculations in the past decade:
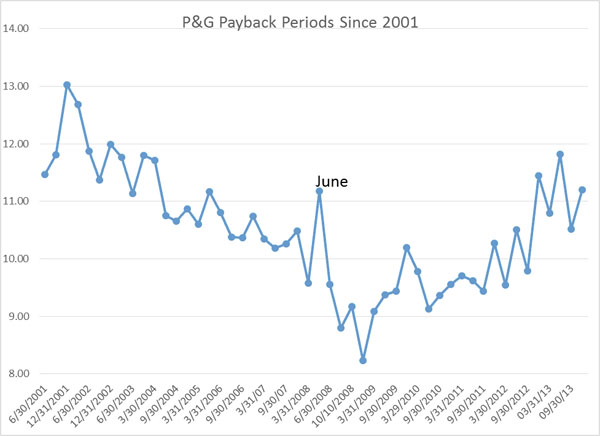
The last time P&G was this richly valued was in mid-2008 (chart marked “June”). That is not dispositive (as demonstrated by the even higher valuations more than a decade ago), but it is cause for concern. We see a difference between a great company and a great stock. We might buy it on a sharp break in the market but otherwise it seems too richly valued.
There are trend changes among sectors. As noted in our last letter, airlines have gotten smarter about nickel-and-diming passengers, running at full capacity, and raising airfares as well. I still wouldn’t want to own an airline with a ten year time horizon, but in the near term many of these stocks remain attractive.
Great individual stocks have stops and starts. Look at Celgene. It returned 115% for the year, but its appreciation was very uneven by quarter: 47.7%, 0.92%, 31.8%, and 9.6%. Same guys. So it hurt our relative performance a bit in the second quarter, but was an enormous contributor for the full year. I can’t time those things, and it wouldn’t be very tax-efficient even if I could.
Finally, there are other stocks that simply perplex us. Cisco may have been my worst purchase of the quarter. All of our metrics had it as a strong buy, but it fell more sharply than I thought warranted based on a relatively modest earnings disappointment. Sorry. Speaking of things that are cheap but disappointing, let’s turn briefly to emerging markets.
Most emerging markets are now valued at exceptionally wide discounts to the US market. Such discounts can persist for long periods of time, and can widen beyond what a reasonable investor might expect. Moreover, we cannot lump all emerging market economies together. Some are very commodity-driven (eg, Brazil, Russia) and do best when commodity prices are rising. Other emerging economies (eg, Vietnam, Philippines) have an advantage that is based much more on competitive labor costs. Emerging markets are often affected by political instability (eg, Turkey at present). I can’t time changes in relative values, but have started to modestly add to our minimal exposure to emerging markets. I think the Chinese Central Committee’s pretty unabashed embrace of a market economy is long-term bullish for China and for commodity-producing economies that sell to China.
We are mindful of tax efficiency. The easy part of this is to sell losing positions toward the end of the year in order to offset capital gains. The good news and bad news is that there were not that many losing positions to choose from this year. The harder part of tax efficiency is sweating right before something goes long-term. For instance, we had a huge gain in Lions Gate Films this year. I wanted to sell the stock [for taxable accounts] in early November, but it went long-term later in the month. It sold off a little before it made sense to sell it, but it was still better to sell it a bit lower than to pay tax at the short-term capital gains rate.
The bottom line is that we see room for further gains, but we don’t want clients lulled into complacent thinking that the market always goes up. In fact, the S&P 500 Index ended the year much further ahead of its 200 day moving average than usual. We think that selectivity and discipline are more important now; for much of this bull market, even overvalued stocks and stocks of not-so-great companies have rallied – sometimes even more than the market. Such trends can persist for longer than expected, but they can also reverse sharply. I just know that valuations suggest that it is a time to emphasize quality – maybe at the expense of missing some high-flying momentum stocks. We’ll do our best to monitor both macro-economic conditions and individual securities in the year ahead in the hope that we can continue to deliver superior results. We greatly appreciate your confidence in us, and are ready to answer any questions or help on financial matters wherever we can. Don’t hesitate to call on us.
* Past performance is not necessarily indicative of future performance. Results for individual clients may vary. Results are not audited. Byrne Asset numbers include all actively managed equity accounts and reflect the reinvestment of dividends and deduction of all fees. As one can not invest in an actual index, for comparative purposes we show returns and other statistics of the Vanguard 500 Index Fund, a mutual fund that very effectively tracks the performance of the Standard & Poor’s 500 Index.