Due to the worst percentage drop in the month of June since 1930, the S&P 500 Index lost 2.7% in the past quarter. We did appreciably better, as your account lost 0.2%. We outperformed because we were reasonably aggressive in the early part of the quarter when the Fed acted decisively to stabilize the market, and then became quite defensive with high cash balances by June. We were over-weighted in energy shares and underweighted in financial shares, which also helped.
The stock market averages this past quarter masked huge divergences among industry groups. Energy was up 16.9%, while financials and consumer discretionary stocks were down 19% and 8.1% respectively. The averages also masked two separate periods within the quarter: a rally off the March lows, and then another dive beginning in mid-May that took us back to the bottom of the year’s range.
In my last letter, I stated that the Fed had taken a huge step to stabilize financial stocks by opening the discount window to investment banks. Indeed, the market rallied for six weeks thereafter. Psychologically, the lows in March at the time of the Bear Stearns debacle became a sort of Maginot Line that the Fed was perceived as defending. But as time passed, it became clear that the Fed was defending that line with limited ammunition. With the dollar weak and inflation on the rise, the Fed is constrained in its ability to cut interest rates further. All that, together with more bad news from financial firms and the real estate market, set up a test of the March lows.
We will see in the third quarter whether all the bad financial and economic news has already been reflected in stock prices. Many securities are trading at valuations not seen in over a decade. Consider AIG, the giant insurer. Our system uses projected earnings to estimate a compound annual return for every stock followed. Analysts have certainly had enough time to reduce earnings estimates to account for any additional write-offs. Here is a chart of my projections for AIG each quarter going back to 2001:
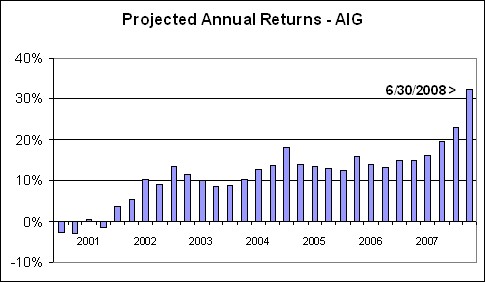
At the outset of the decade, AIG could do no wrong. As the chart shows, our model projected negative returns on the stock, which means that people were willing to bet on a continually rising PE ratio and/or continually rising earnings estimates in order to achieve a positive return. Now, AIG can’t find a friend. If it realizes current earnings projections, and can garner a relatively low PE ratio of 11.7, we should earn a compound annual return on the stock of over 30%. Such a scenario does not arise in a risk-free environment, and AIG certainly has significant exposure to the credit crisis. It is very hard to resist an opportunity like this, particularly when we’ve done well on so many other stocks over time with similar risk-reward characteristics.
Nevertheless, I remain cautious in light of market action to date this year. Market history teaches that things which are cheap can get cheaper. I’m inclined to be conservative and maintain high cash balances until there are clearer signs of a market bottom. Your account is about 22% in cash. As we learned during our 50% year in 2003, you don’t have to be the first one in a bull market to do very well in it. Further, trends in both directions can last a lot longer than most market participants initially anticipate. That was true in the dot-com bust. More recently, the bull market in energy has gone on longer than most have expected, and the bear market in real estate has also continued beyond most predictions (including mine).
Let’s look at some of these sectors more closely. As you know, I rarely deviate more than 50% from an industry group’s weighting in the S&P 500. Energy stocks now account for about 14% of the S&P 500 Index. Part of the reason we’ve done well is that our portfolio had been about 50% over-weighted in energy stocks; we have recently cut this to about a market weighting. I wish we had been even more aggressive, but I don’t want portfolios to become too concentrated. As a stock accelerates, I tend to tighten my stop-loss parameters in an effort to let the profit run as far as possible while minimizing potential drawdowns. My energy stops have gotten tighter (and some were hit early in July). Some energy positions, such as Penn West (PWE), have yields in excess of 10% in addition to strong appreciation so far this year.
Many politicians and some analysts are blaming high energy prices on rampant speculation. That is hard to measure. But it is clear that developing Asian nations such as China and India are using energy at an accelerating pace. A Chinese middle class that is 300 million strong is buying cars and moving from street level dwellings into high rises with elevators, modern lighting and air conditioning. It is also true that the terrible earthquake in China has weakened many dams in Sichuan Province. This will limit China’s hydro power in the next few months, and is likely to cause China to rely more on coal and other sources of energy. We are invested in oil stocks, natural gas and coal, and more recently, some alternative energy plays such as wind power. Awhile back, I cut back our exposure to oil refiners such as Valero and Tesoro because refining margins are actually quite low. The biggest profits are from appreciating inventories, not from price gouging at the refining stage.
High energy prices have impacted consumer stocks. The theory is that whatever discretionary dollars consumers had are now going into gas tanks. Higher end retailers have suffered, and stocks like Wal-Mart did relatively well (+6.7%) on the theory that consumers would buy what they needed at the cheapest prices possible. I lightened up on Wal-Mart toward the end of the quarter, because consumers may buy less stuff, period. Even so, consumer spending statistics continue to surprise many economists for not having completely dried up. But even many traditionally “safe” stocks were down this quarter. Proctor & Gamble lost 13.3% and Walgreen lost 14.7%. GM lost 40% and many specialty retailers dropped by over 25%; we did a pretty good job of avoiding those.
My biggest disappointment of the quarter was housing. This sector rallied sharply in the first quarter, and I thought there was a reasonable chance that the housing market was ending a three-year slide. Moreover, stocks like Hovnanian had been down more than 90% from their peaks. There are credible arguments that housing prices are now back in line with their values relative to purchasing power. Also, US housing prices are much more reasonable than in many parts of Europe. However, housing stocks did not hold their gains. Our performance for the quarter would have been even better without them.
The continued weakness in real estate kept alive fears of additional write-offs in the financial sector. At some point, the market will overreact to these fears. The major concern is over so-called Tier 3 assets. These are assets that are difficult to value — as distinct from lacking in value. Just because nobody wants to buy your house today doesn’t mean your house is worthless. At some point, there will likely be a boomerang effect in financial stocks as firms are perceived to have over-reserved for losses. When financial firms reverse course, it could be a sudden and sharp initial move.
For now, however, most of the market indicators I follow suggest caution. The S&P 500 Index remains well below its 200 day moving average. In fact, the market reversed course when it traded up to this moving average in mid-May and could not hold that level. I don’t suggest any predictive value in moving averages, but price levels relative to moving averages are indicative of trend. Earnings momentum also remains negative. Thompson Reuters Proprietary Research now expects the year-over-year decline in corporate profits to accelerate to a 10.2% drop. Even so, overall S&P 500 earnings would be up, but for the financial stocks. Though the market is still reasonably cheap relative to interest rates, it is no longer at the compelling levels of mid-March. Interest rates have climbed somewhat since then. (It is worth noting parenthetically that fixed income was not a good place to hide during the quarter; the return on 5 year Treasury paper for the quarter was negative 3%).
The most favorable indicator is absolute valuations on certain stocks, but as I indicated, who knows when “value” becomes “deep value”. For example, analysts think that Lehman Brothers will earn $3.70 per share in its next fiscal year. That means the stock is trading at a forward PE ratio of 6.2. Citigroup is trading at a forward PE of 6.5, and AIG is trading at a remarkable forward PE of 4.6. Although earnings estimates should be discounting a lot of what can go wrong, many investment managers are too worried about unforeseen write-offs to commit heavily to these stocks. Indeed, Wall Street has begun to cannibalize itself as investment firms recommend the sale of other financial institutions (see, eg, Goldman Sachs’ recent recommendation that aggressive investors take short positions in Citi). One argument is that weakness will spread from mortgages to other types of consumer loans. But at some point, many of these firms are bound to be bargains – either because real estate prices stabilize or real estate assets are moved off balance sheets and into entities where they don’t have to be marked to market and reflected in quarterly earnings.
Similarly, some consumer stocks are valued as if people will never shop again. Coach (COH) has grown earnings at over 30% annually in recent years but has a PE ratio of only 12 times next year’s projected earnings. At some point, people will be asking themselves why they didn’t buy when things were cheap. In the meantime, though, our job is to prevent excessive losses until things settle. We try to be defensive without giving away all upside potential. The balancing act is between capital preservation and capitalizing on situations that will provide substantial returns over time. I continue to believe that if we can continue to add a few percentage points to returns on the S&P 500 each year, as we have done, we will continue to do very well over time.
Bottom line is that even in a bad quarter for the market, I am able to report a very solid relative performance. We continue to refine the techniques that produce these results. While there are no guarantees, I hope to deliver similarly good relative performance as the year continues to unfold. At some point, strong relative performance will be on top of an up market!
As always, please do not hesitate to contact me with any questions or concerns. It is always appropriate to re-assess asset allocation parameters, and to discuss other investment-related questions that you may have. I’m happy to help in any way I can, and appreciate your continued confidence.
* Past performance is not necessarily indicative of future performance. Results for individual clients may vary. Results are not audited. Byrne Asset numbers reflect the addition of certain dividends and deduction of all fees. S&P numbers are based on the total return of Vanguard’s S&P 500 Index Fund.